
The Apple developer’s kit for the iPhone and the Google phone is getting a lot discussion in the press. They are just two examples of that “innovation” has been getting attention recently. Despite all the discussion on innovation, I don’t feel like there is a standard language or measure to accurately describe what’s going on. Here are some graphs that I’ve been carrying around in my head, which are trying to categorize innovation or at least start to recognize patterns. As a proxy for innovation, I’m using hacks, which I defined broadly, as modifications to a product or system or service, for some unintended use, application, or outcome by the original source. The relationship between hacking and innovation probably deserves its own post, which I’ll try to get to soon.
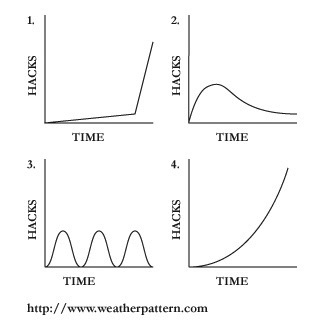
In the graph, the y axis is roughly the number or frequency of hacks, which doesn’t have a scale, because it’s based on theoretical model. The x axis is time and show how the number of hack change over time. The graph isn’t always upward because hacks can become obsolete or blocked.
Graph 1 Creative Destruction: Schumpeter‘s ideas on creative destruction talks about how a disruptive technology or change affects the rate of hacks and innovation can be caused by events. An obvious example is Facebook’s decision to allow third part developers to create applications for its site. Overall, this situation doesn’t depend on moving from a open to a closed system. Sometimes a technical innovation that allows for innovation. For instance, movable type and wordpress blogging software made the web much more hackable by removing the need to know much about html and ftp to start a blog.
Graph 2 Eventual Obsolescence shows how a product or service, which is very hackable, can become less so over time. Many factors can be the cause of this change. Sometimes it is a matter of the product becoming more sophisticated, which makes modification harder for the amateur hacker. For instance, a Ford LTD station wagon from the 1980s was much easier to hack than a 2008 BMW 5-Series 535XI Wagon, which uses more synthetic materials and is loaded with electronics. In this case, automakers didn’t make create more sophisticated specifically to stop hacking. Open system become closed intentionally, as seen in the telephone system which was originally much easier to hack than it is today.
Graph 3 Build-A-Better-Mousetrap is the typical game that closed manufactures or service providers play with hackers. This is often the case for apps to break DRM or download songs off an iPod, where each software upgrade plugs up the hole, or in some cases turn your iPhone into a brick. People are trying to innovation, but their progress faces impediments. This start and stopping isn’t always a bad thing. Spam, besides masking originating email addresses, is essentially a hack of text (and interesting notion within itself,) where malicious email is created by altering text in order to fool spam filters into thinking its contain is legitimate.
Graph 4 Network Effects is a model of an open platform, such as Facebook, after they released their developer’s kits. The idea than an open platform will create value by increasing the users options, which will lead to more users. More users, in turn, will encourage more innovation, or so the ideal case goes. Nokia has an developer’s kit and Apple intends to do the same for phone. However, this example isn’t necessary an ideal as well. Too many apps creates too many choices, which can confuse and ultimately drive away users.
Identifying these patterns and clusters are only the first step. The steps will probably involve identifying outcomes and finally measures (even qualitative ones) to describe what happened. So, there is a lot to do, but this is a start.


Very nice typology–u should send it to Clayton Christensen, researcher of “the Innovator’s Dilemma”.
I’m with you on the disadvantages of network effects. I’m getting all sorts of stupid app-requests on facebook–hot potato! be a zombie! superpoke!
As Kelly of YouTube fame would say: What the hell?!
One issue here might also be the problem of forking–when hacks of a particular kind end up making a hacked version of a product or service too different to be fully compatible with the baseline version.
Update: Nokia’s N800 run a version of Linux and is an open platform. Brazilian programmers made a touch keyboard app that emulates the iPhone interface, reported by engadget.